ggplot theme used in the book Research Design in the Social Sciences
Source:R/theme_dd.R
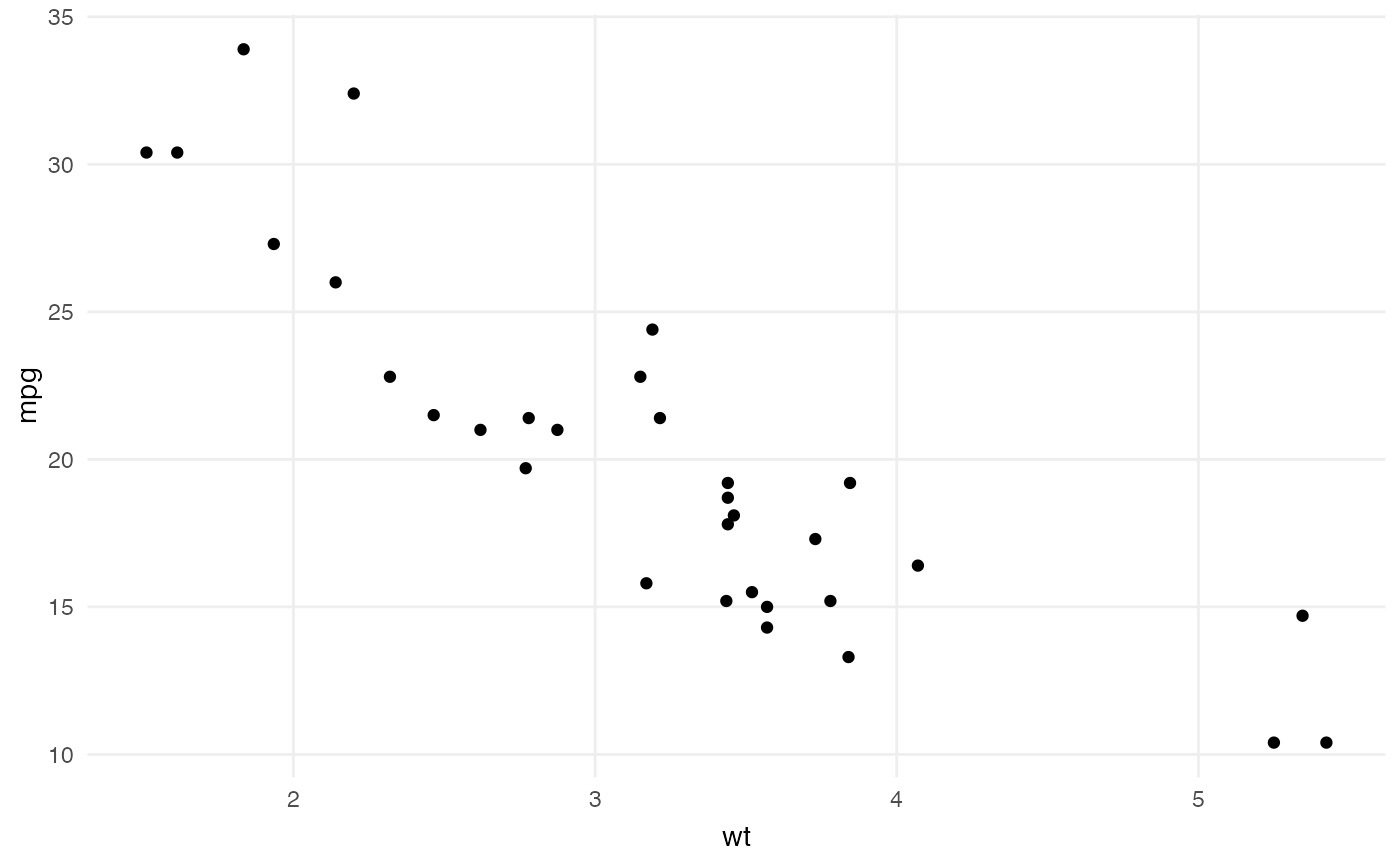
theme_dd.Rdggplot2::theme_minimal() with light gray major gridlines only, no axis ticks, and no legend. The book labels series directly, so it hides the legend; add theme(legend.position = "right") after it to get one back.
Examples
library(ggplot2)
ggplot(mtcars, aes(wt, mpg)) + geom_point() + theme_dd()