library(DesignLibrary)
designs     <- expand_design(two_arm_designer,
                             ate = seq(0, 1, 0.1), N = c(20, 200))
simulations <- simulate_design(designs)Mostly we use design diagnostics to assess issues that arise because of design decisions. But you can also use these tools to examine issues that arise after implementation. Here we look at risks from publication bias and illustrate two distinct types of upwards bias that arise from a “significance filter.” A journal for publishing null results might help, but the results in there are also likely to be biased, downwards.
Two distinct problems arise if only significant results are published:
- The results of published studies will be biased towards larger magnitudes.
- The published studies will be unrepresentative of the distribution of true effects in the relevant population of studies.
These two problems are quite distinct. The first problem is more familiar: conditional on any true effect size, larger estimates have an easier time passing the statistical significance filter, so the distribution of published results will be biased upwards because it will be missing all of the smaller estimates. The second problem is more subtle. If different studies seek to measure effects that are of different size, conditioning on statistical significance means that we are more likely to learn from places that have large effects than from places that have small effects. The significance filter means that our answers to any particular question will be biased and it means that the set of questions we see answers to will be biased as well. The Journal of Significant Results is a poor guide to the true distribution of causal effects.
What about a Journal of Null Results? Such a journal would condition acceptance on failing to achieve statistical significance. The set of articles published in such a journal would also be biased. We’ll explore this idea with a quick simulation.
The two_arm_designer function in the DesignLibrary package generates designs for a basic two-arm trial in which, by default, half the units are assigned to treatment and the remainder to control. (See ?two_arm_designer for more details.) We’ll use this function to make a sequence of designs. We’ll vary the true value of the estimand, the average treatment effect (ate), from 0 to 1 and we’ll consider two sample sizes, N = 20 and N = 200.
The data.frame simulations records results from running these designs many times—equivalent here to implementing many independent studies from a large population of possible studies. The figure shows a scatterplot of the estimand versus the estimate for each run of the study. We facet by whether we condition on significance, nonsignificance, or nothing at all.
`summarise()` has grouped output by 'N'. You can override using the `.groups`
argument.
Warning: Using `size` aesthetic for lines was deprecated in ggplot2 3.4.0.
ℹ Please use `linewidth` instead.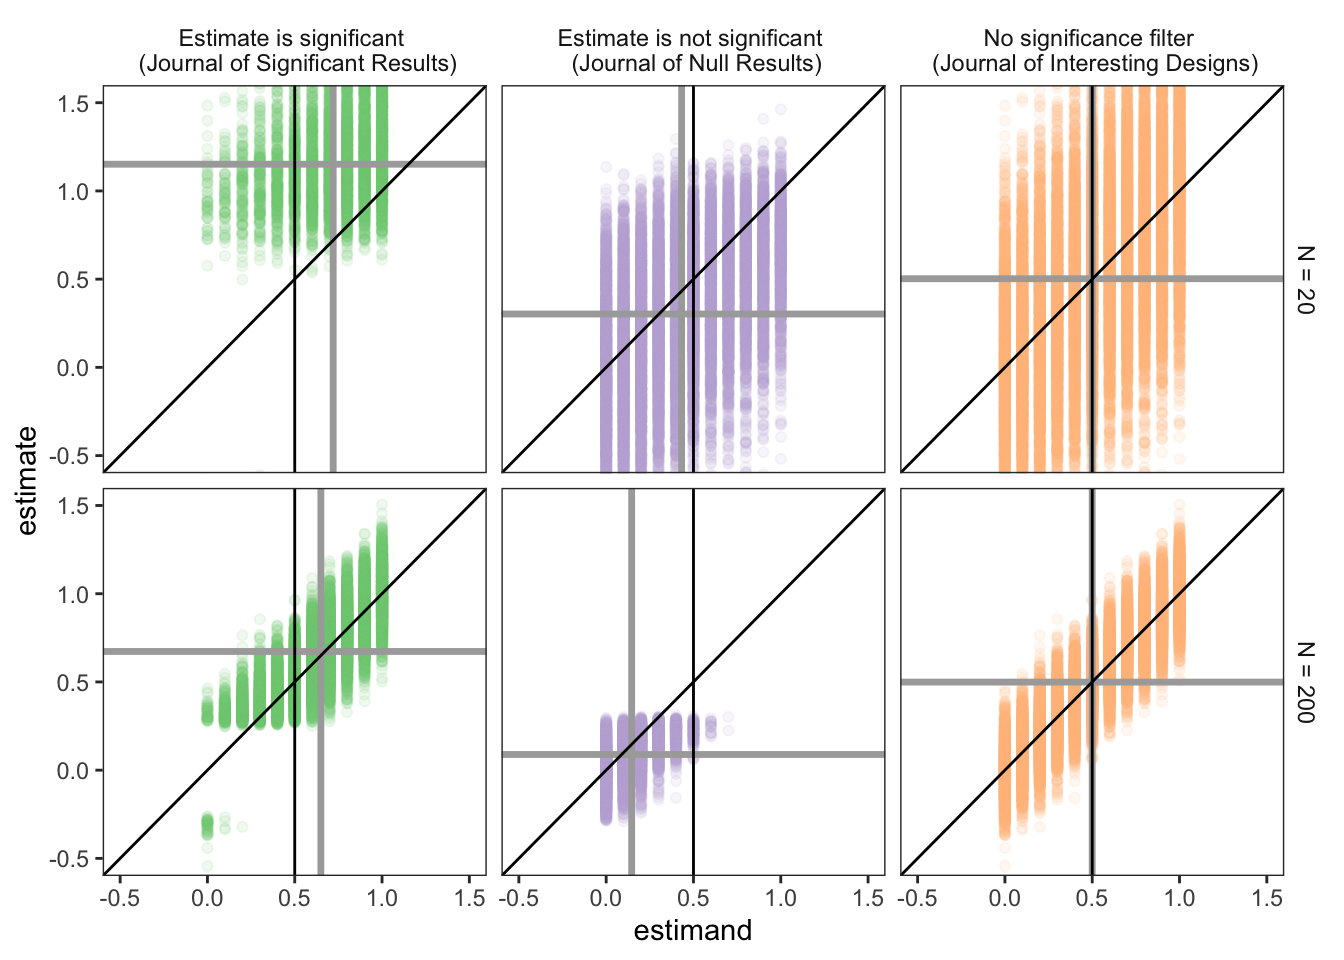
Looking first at the Journal of Significant Results, we see the familiar problem: the average estimate is biased away from the true value of the estimand. This problem is greatly helped by increasing the sample size. But we can also see the second problem – the distribution of estimands (the true effects under study) is also biased towards larger effects, this problem is also allayed, though less dramatically, by larger sample sizes.
The Journal of Null Results suffers from a parallel problem, only in reverse. Now estimands are smaller than is typical in the population and, on average, estimates are biased down relative to these estimands. Strikingly, the bias in estimand selection is worse at the larger sample size (though downwards bias within the set of published studies is smaller).
Now, we agree that proactively publishing null results may help when considering entire research literatures as a whole, and for this reason alone a Journal of Null Results is probably a good thing.
But, better would be to not do any conditioning at all. The Journal of Interesting Designs would condition only on the question being interesting and the design being appropriate to answering the question. We see that the distribution of estimates and estimands are both centered on the correct average value.
Code to produce figure
For those who are interested, here is the code to produce the above figure.
library(tidyverse)

levels <- c("Estimate is significant \n (Journal of Significant Results)",
            "Estimate is not significant \n (Journal of Null Results)",
            "No significance filter \n (Journal of Interesting Designs)")

sims_1 <- simulations %>% mutate(filter = if_else(p.value < 0.05, levels[1], levels[2]))

sims_2 <- simulations %>% mutate(filter = levels[3])

gg_df <- bind_rows(sims_1, sims_2) %>%
  mutate(N = paste0("N = ", N), filter = factor(filter, levels = levels))

summary_df <- gg_df %>%
  group_by(N, filter) %>%
  summarise(mean_estimand = mean(estimand),
            mean_estimate = mean(estimate))

ggplot(gg_df, aes(x = estimand, y = estimate, color = filter)) +
  geom_point(alpha = 0.1) +
  geom_vline(data = summary_df, aes(xintercept = mean_estimand), size = 1.2, alpha = 1, color = "darkgrey") +
  geom_hline(data = summary_df, aes(yintercept = mean_estimate), size = 1.2, alpha = 1, color = "darkgrey") +
  scale_colour_brewer(type = "qual") +
  geom_abline() +
  geom_vline(xintercept = 0.5) +
  facet_grid(N ~ filter) +
  coord_cartesian(xlim = c(-0.5, 1.5), ylim = c(-0.5, 1.5)) +
  theme_bw() +
  theme(legend.position = "none",
        strip.background = element_blank()) +
  theme(panel.grid.minor = element_blank(), panel.grid.major = element_blank(), panel.background = element_blank())